|
Content
|
Ready to simulate
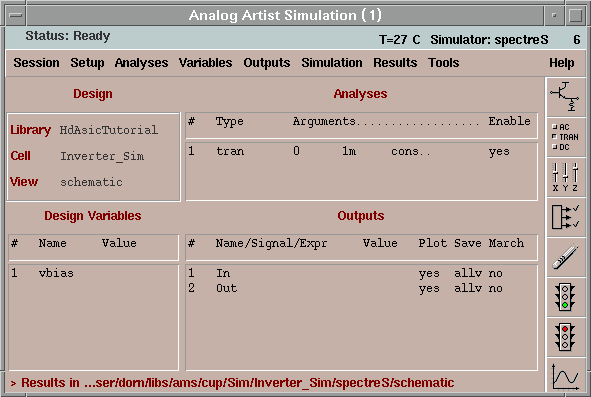
To start the analog simulation we must choose Tools -> Analog Artist. The user interface of the simulator is called
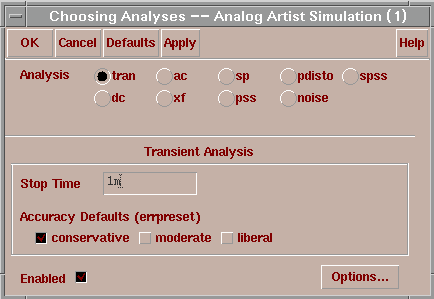
Analog Artist. With Analyses -> Choose we select the necessary
analyses tran (transient) and a 1ms stop time.
Now we add our signals to plot with
Outputs -> To Be Plotted -> Select On Schematic and
select with the mouse the In and Out wire. The Analog Artist shows now the
signals in the outputs.

The schematic is ready to run. Simulation -> Run or click the green traffic light at the right panel of Analog
Artist starts the simulation. After the simulation is finished the
waveform window pops up. For a better view you can split the two curves Axes -> To Strip. For advanced views please look at the
online help.
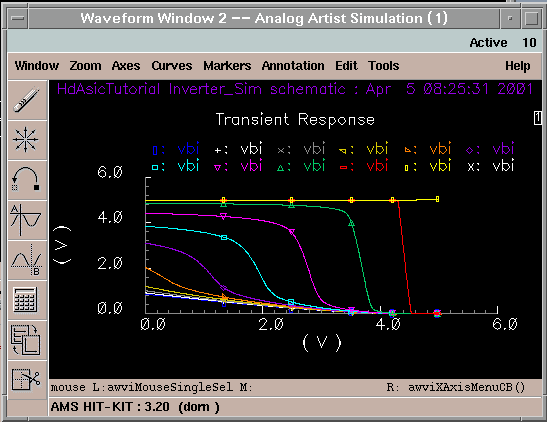
Parametric Analysis
The parametric plot is powerful tool. You can run an analysis 100 times with different values automatically. For instance we want to know in which way the bias voltage influences the output voltage. First we must change the voltage value in the schematic of the Bias voltage source to a variable (e.g. vbias).
In Analog Artist you execute Variables -> Copy From Cellview and the variable appears
in the variable box of Analog Artist.
With Tools -> Parametric Analysis the settings for the parametric simulations appears. As variable
we use vbias, as range we prefer 0V
to 5V and as steps we choose 11.
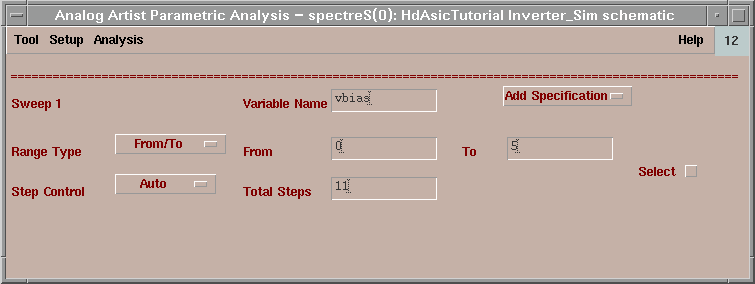
Analysis -> Run starts the simulation.
An other waveform window cames up. By altering the x axis and deleting the input
curves we obtain the following window.
|